Dashboard
The OCPPLab Dashboard: how the sidebar is organized, where each page lives, and the guide for every area.
The Dashboard is the signed-in operator console for OCPPLab. Everything you see is scoped to the organization selected in the top bar.
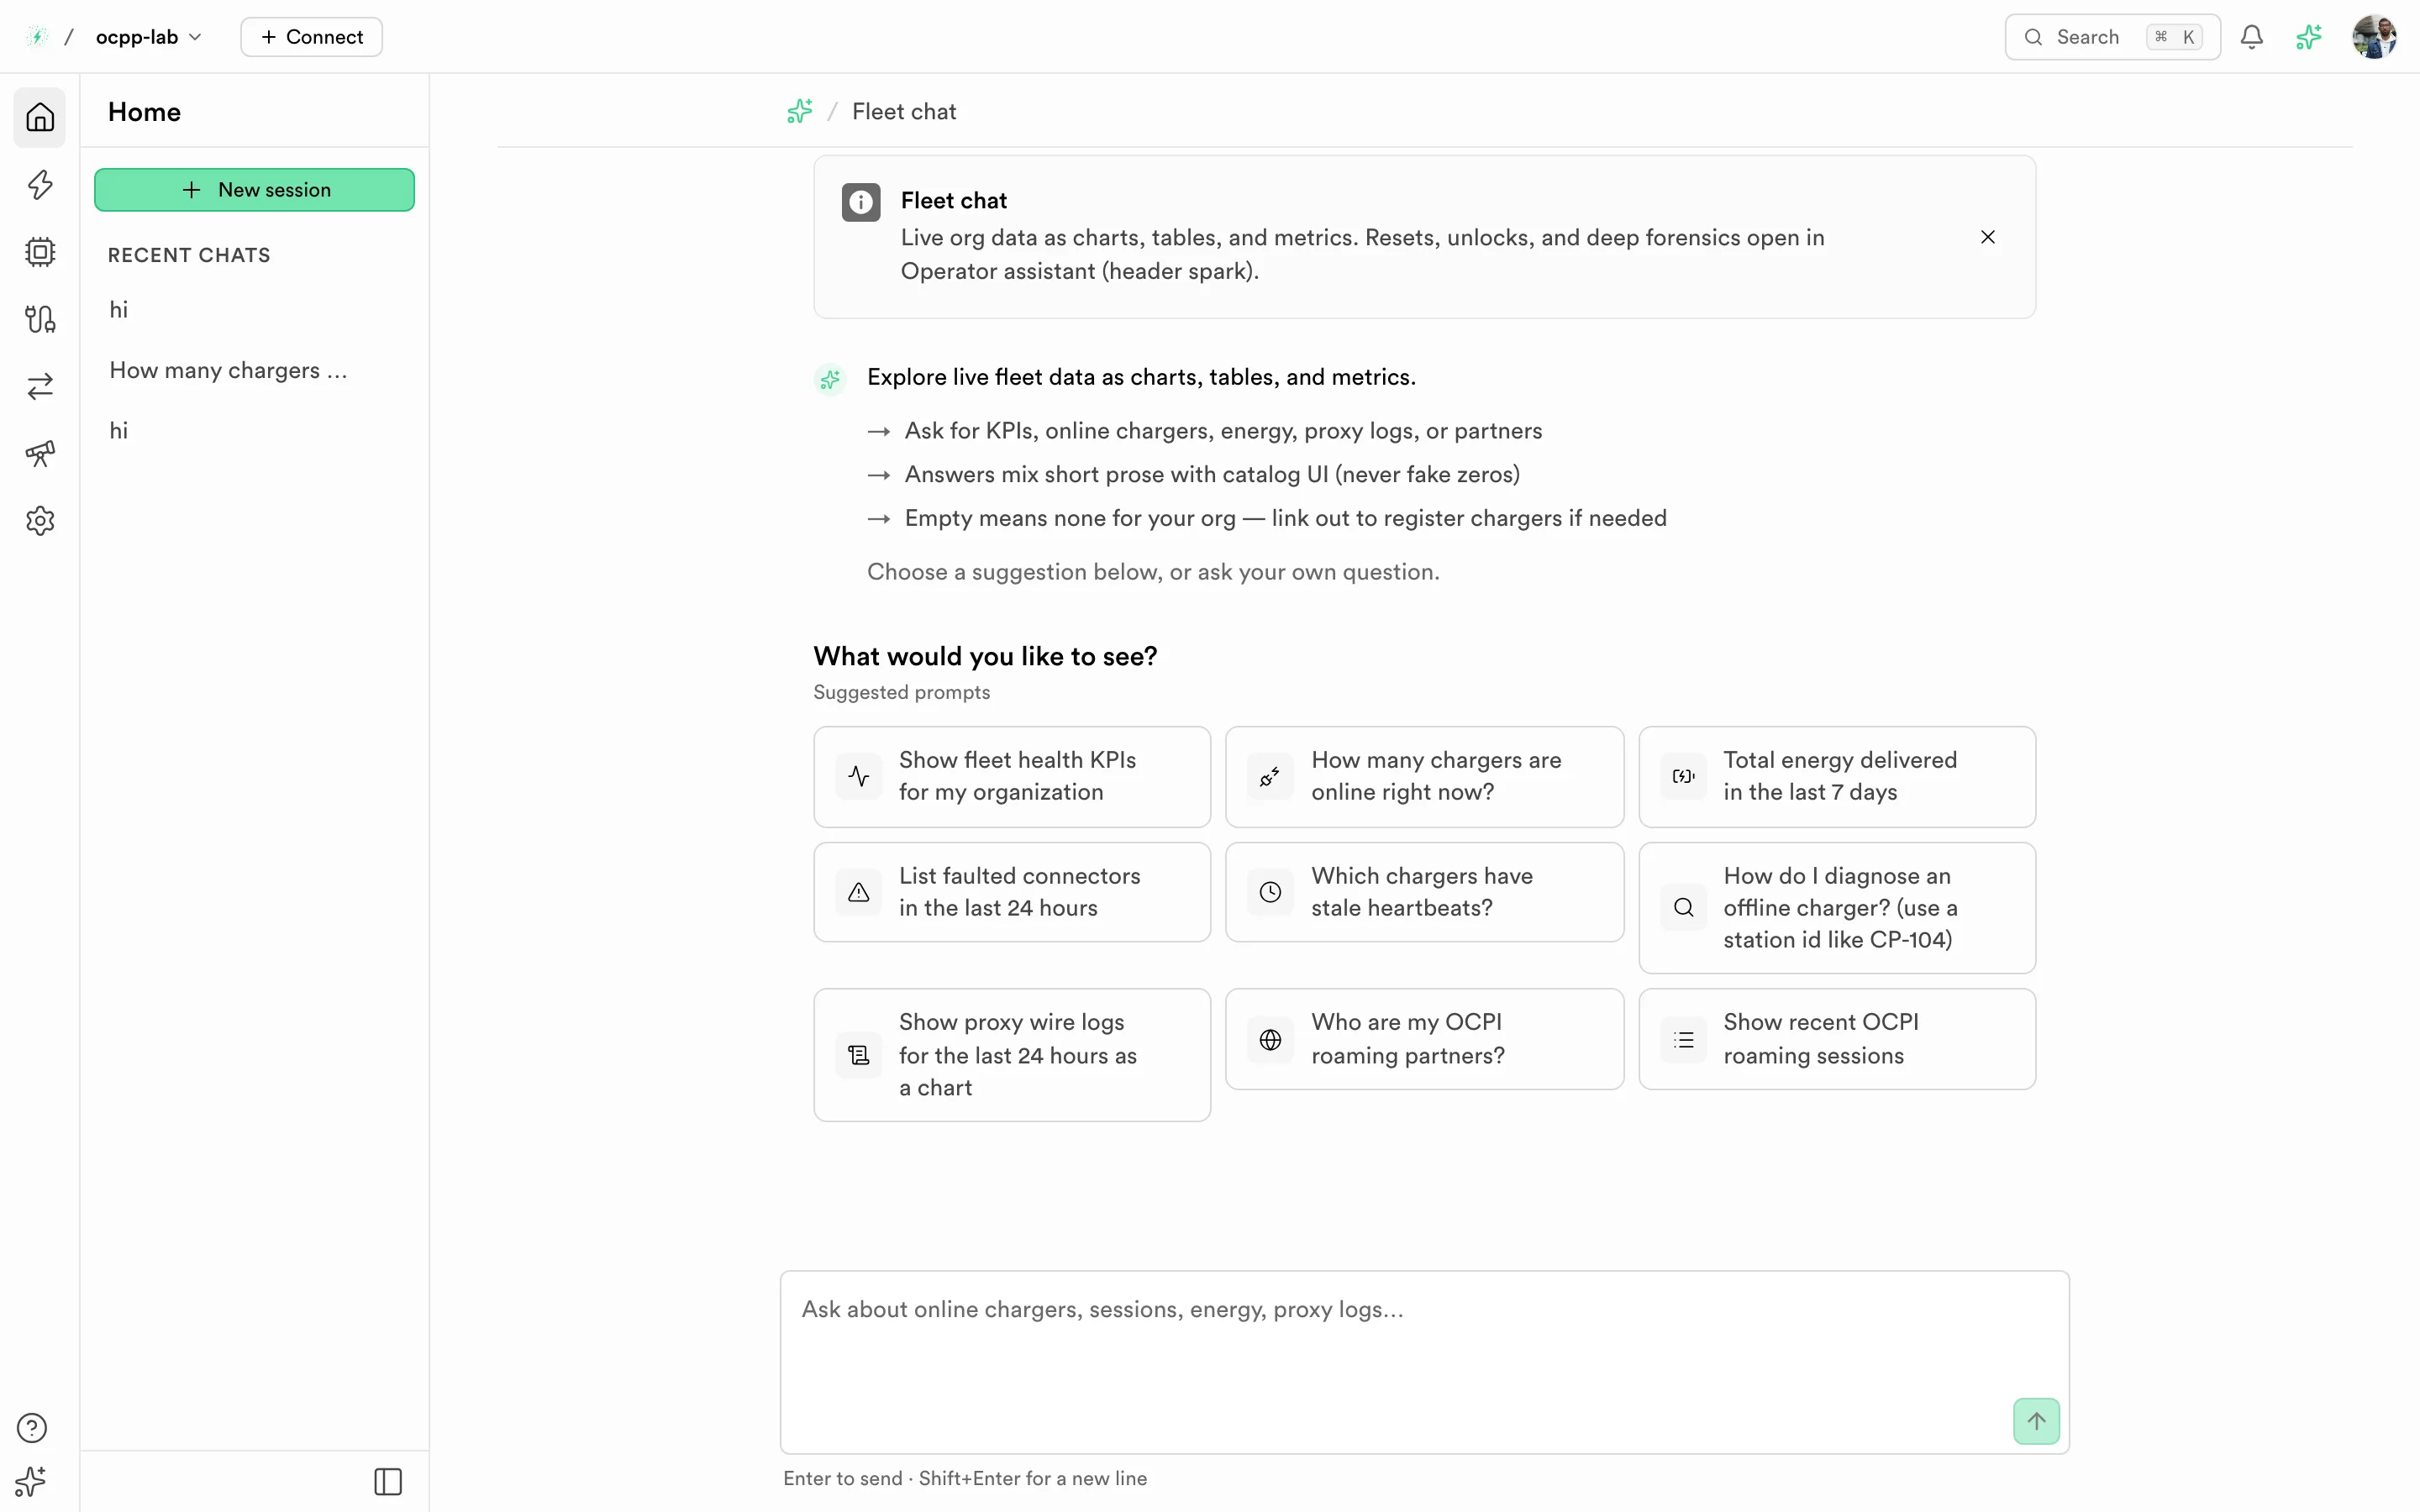
Dashboard home. The area rail is on the left, Fleet chat fills the page, and the top bar holds the organization switcher, Connect, and search.
How the Dashboard is organized
| Layer | What it is |
|---|---|
| Area rail | The icon column on the far left. It switches between areas: Home, Charging management, Virtual charger, Proxy, Roaming, Observability, and Settings |
| Page panel | The pages inside the active area, for example Managed chargers, Managed tariffs, and OCPP map under Charging management |
| In-page tabs | Some pages group related lists as tabs. Managed chargers has Locations, Charge Sessions, Tokens, and Logs tabs |
| Top bar | Organization switcher, Connect (endpoints and credentials), search (⌘K), notifications, the operator assistant, and your account |
Every page has a stable URL, so you can bookmark a tab or share a link to a single charger.
Guides by area
Home
| Guide | Path | What you do there |
|---|---|---|
| Fleet chat | /dashboard | Ask questions about your fleet and get answers as tables, charts, and metrics |
Charging management
| Guide | Path | What you do there |
|---|---|---|
| Managed chargers | /dashboard/chargers | Watch connection state, heartbeats, and faults across the fleet |
| Create a charger | Add charger on Managed chargers | Register a station, field by field |
| Charger detail | /dashboard/chargers/{identity} | Inspect one station: connectors, sessions, logs, configuration, firmware |
| Charger sites | /dashboard/chargers?tab=sites | Group chargers by location and publish them for roaming |
| Charge sessions | /dashboard/chargers?tab=sessions | Follow transactions, energy, and cost |
| Authorizations | /dashboard/chargers?tab=tokens | Manage the RFID and token list that chargers authorize against |
| Logs | /dashboard/chargers?tab=logs | Read the OCPP messages exchanged with your chargers |
| Managed tariffs | /dashboard/tariffs | Create CPO tariffs and apply them to chargers |
| OCPP map | /dashboard/maps/ocpp | See managed stations on a map |
Other areas
| Guide | Path | What you do there |
|---|---|---|
| Virtual charger | /dashboard/virtual-charger | Run lab charge points without hardware and drive them over OCPP |
| Proxy | /dashboard/ocpp-proxy | Route chargers to one or more CSMS backends and read wire logs |
| Roaming | /dashboard/roaming | Connect OCPI partners, sync data, and test the integration |
| Observability | /dashboard/observability | Check backend and charger health, and manage webhooks |
| Workspace | /dashboard/settings | Account, organization, teams, billing, and usage |
Day-1 path
- Complete the Quickstart.
- Create a charger and copy its CPMS WebSocket URL.
- Point the station at that URL. See Connect a charger. No hardware yet? Deploy a virtual charger instead.
- Wait for Online on Managed chargers.
- Start a test session and find it on Charge sessions.
Protocols in the Dashboard
| Protocol | Versions | Where it appears |
|---|---|---|
| OCPP | 1.6 · 2.0.1 · 2.1 | Charging management, Virtual charger, Proxy. The station advertises its version on the WebSocket subprotocol (ocpp1.6, ocpp2.0.1, or ocpp2.1) |
| OCPI | 2.1.1 · 2.2.1 · 2.3.0 | Roaming partners, the OCPI catalog, and tariffs |
How the Dashboard shows missing data
The Dashboard never fills a gap with an invented value. A field the platform has not measured shows —, and a list with no rows says so instead of showing demo data. A 0 always means a real count of zero.